Developer Access to Shodan Trends
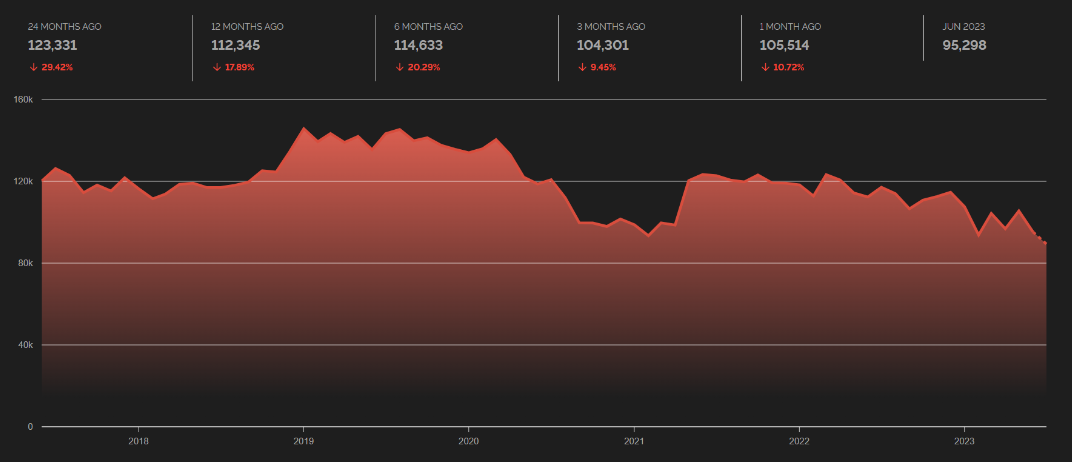
As a quick recap, Shodan Trends is a website that lets you see how the Internet has changed over time. For example, you can use it to see how exposed industrial control systems have been over the years:
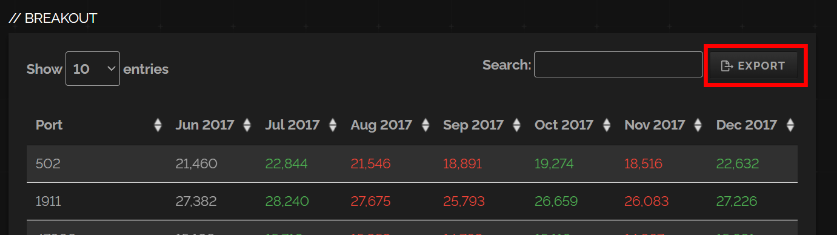
Up until now, the only option to download the information was to click on the Export button in the table:
We're happy to announce that Shodan Trends now has a developer API that you can access with your Shodan API key. The API is documented in a Postman collection which you can check out here:
The Shodan CLI has also been updated with a new shodan trends command so you can take advantage of the API without having to write any code. For example, the following command shows the total number of industrial control systems over time:
shodan trends tag:ics
The optional facet lets you get a breakdown over time for a specific property. For example, a breakdown of the top countries that have exposed industrial control systems:
shodan trends --facets country tag:ics
By default, the API will return the top 5 values for the property. However, you can tell the API to return more than 5. For example, the following gives a breakdown of the top 20 ports that have been seen on the 198.20.69.0/24 network over the past few years:
shodan trends --facets port:20 net:198.20.69.0/24
The results can be saved to a file using the -S option (or -O <filename>) which will generate a gzip-compressed JSON file where each line contains a JSON object representing 1 month of information. For example, the following is the JSON object for July 2023 for the command shodan trends --facets country:10 tag:ics:
{"month": "2023-07", "count": 89333, "facets": {"country": [{"count": 25835, "value": "US"}, {"count": 5504, "value": "IT"}, {"count": 5305, "value": "ES"}, {"count": 4105, "value": "CA"}, {"count": 3697, "value": "FR"}, {"count": 3510, "value": "KR"}, {"count": 3163, "value": "DE"}, {"count": 3131, "value": "TR"}, {"count": 2506, "value": "RU"}, {"count": 2352, "value": "SE"}]}}
There are a few technical considerations:
- You can only request information about 1 facet at a time.
- The API calls can take a while to complete (at least several seconds).
- Data is only indexed going back to 2017. We have historical data that goes back farther but it's not yet indexed.
That being said, the API is available to all members so check it out if you're looking for a way to programmatically see how the Internet has changed over the past few years.